Top 5 Technical Indicators for Beginners
As a new trader, understanding technical indicators is crucial for analyzing market trends effectively. Here are the top 5 technical indicators that every beginner should know to start their trading journey on the right foot.
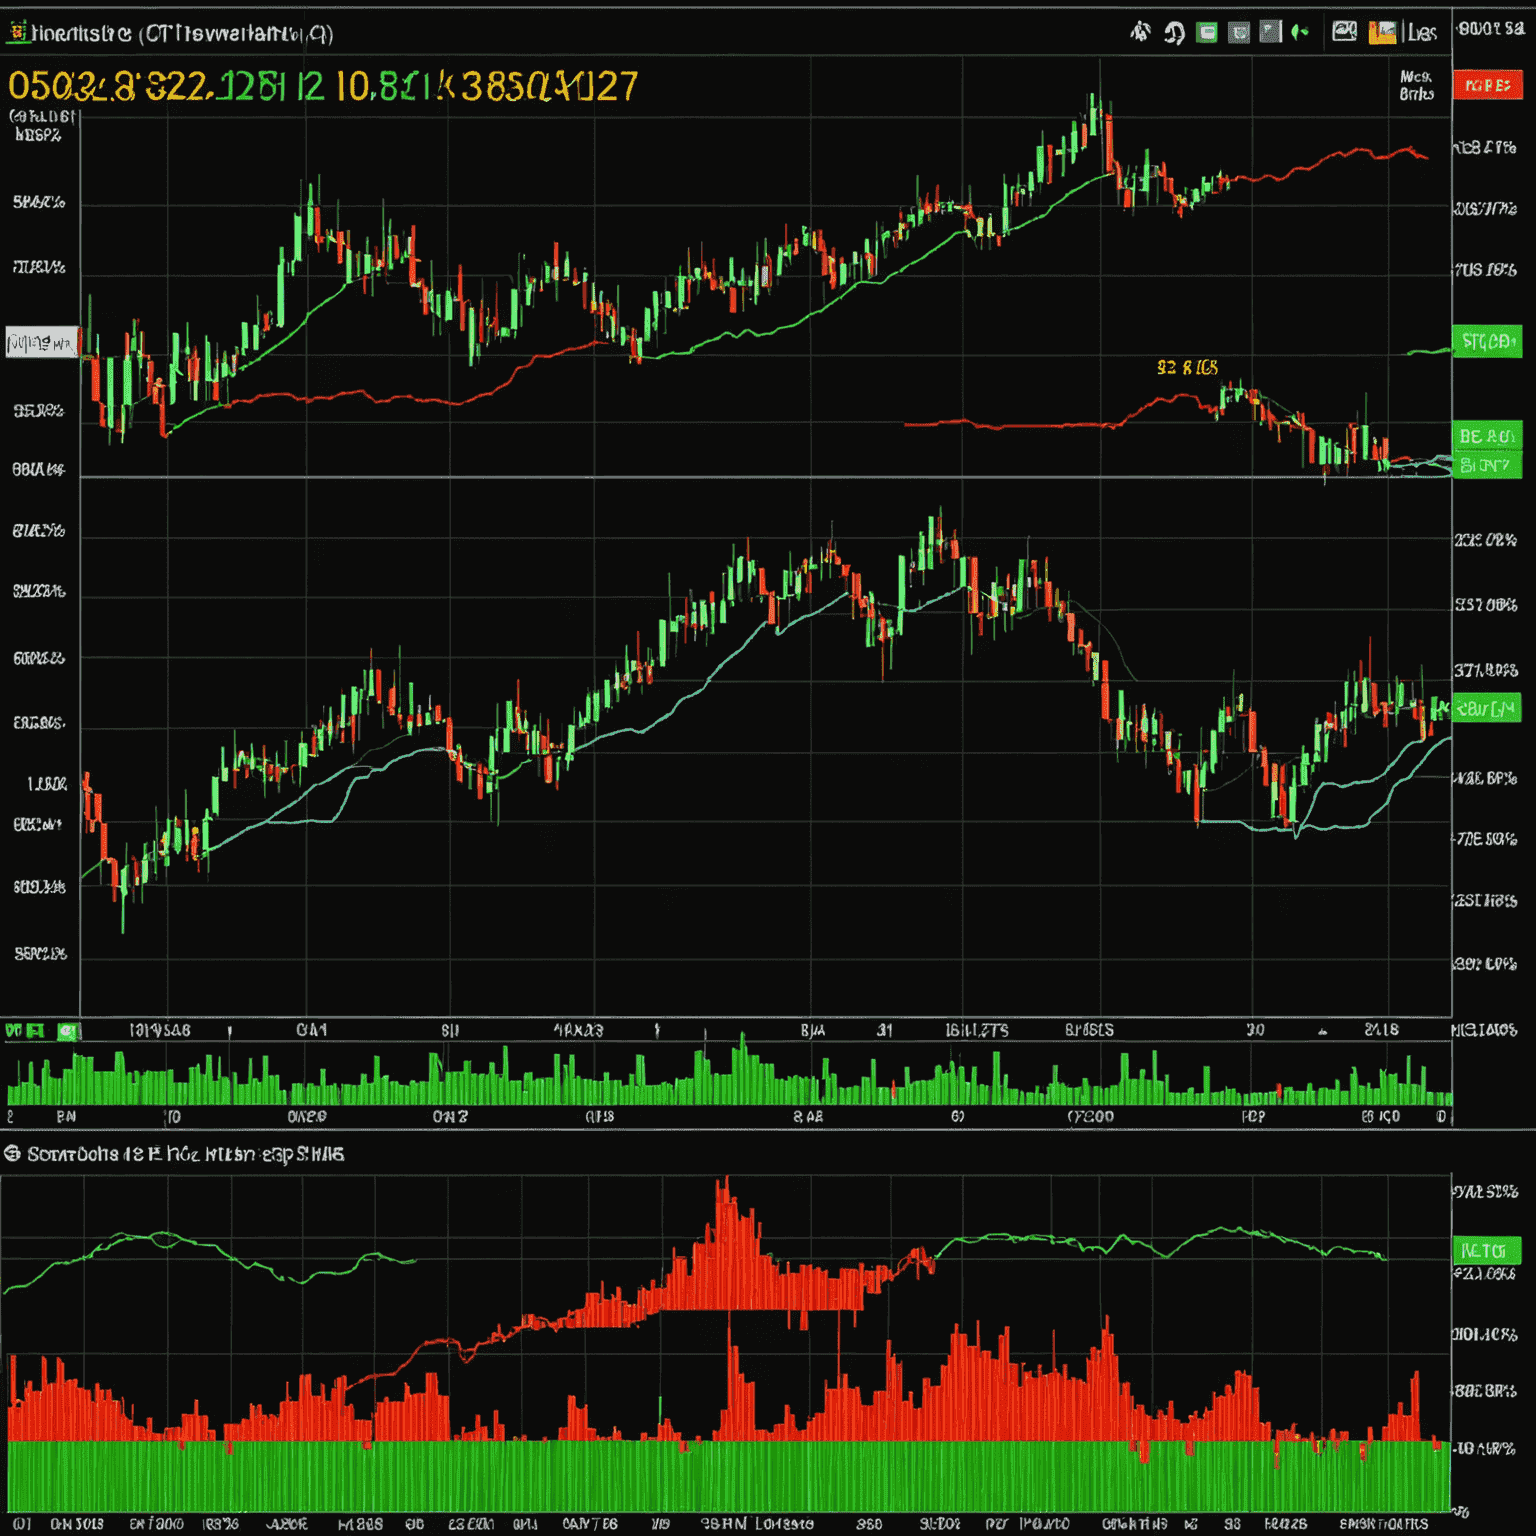
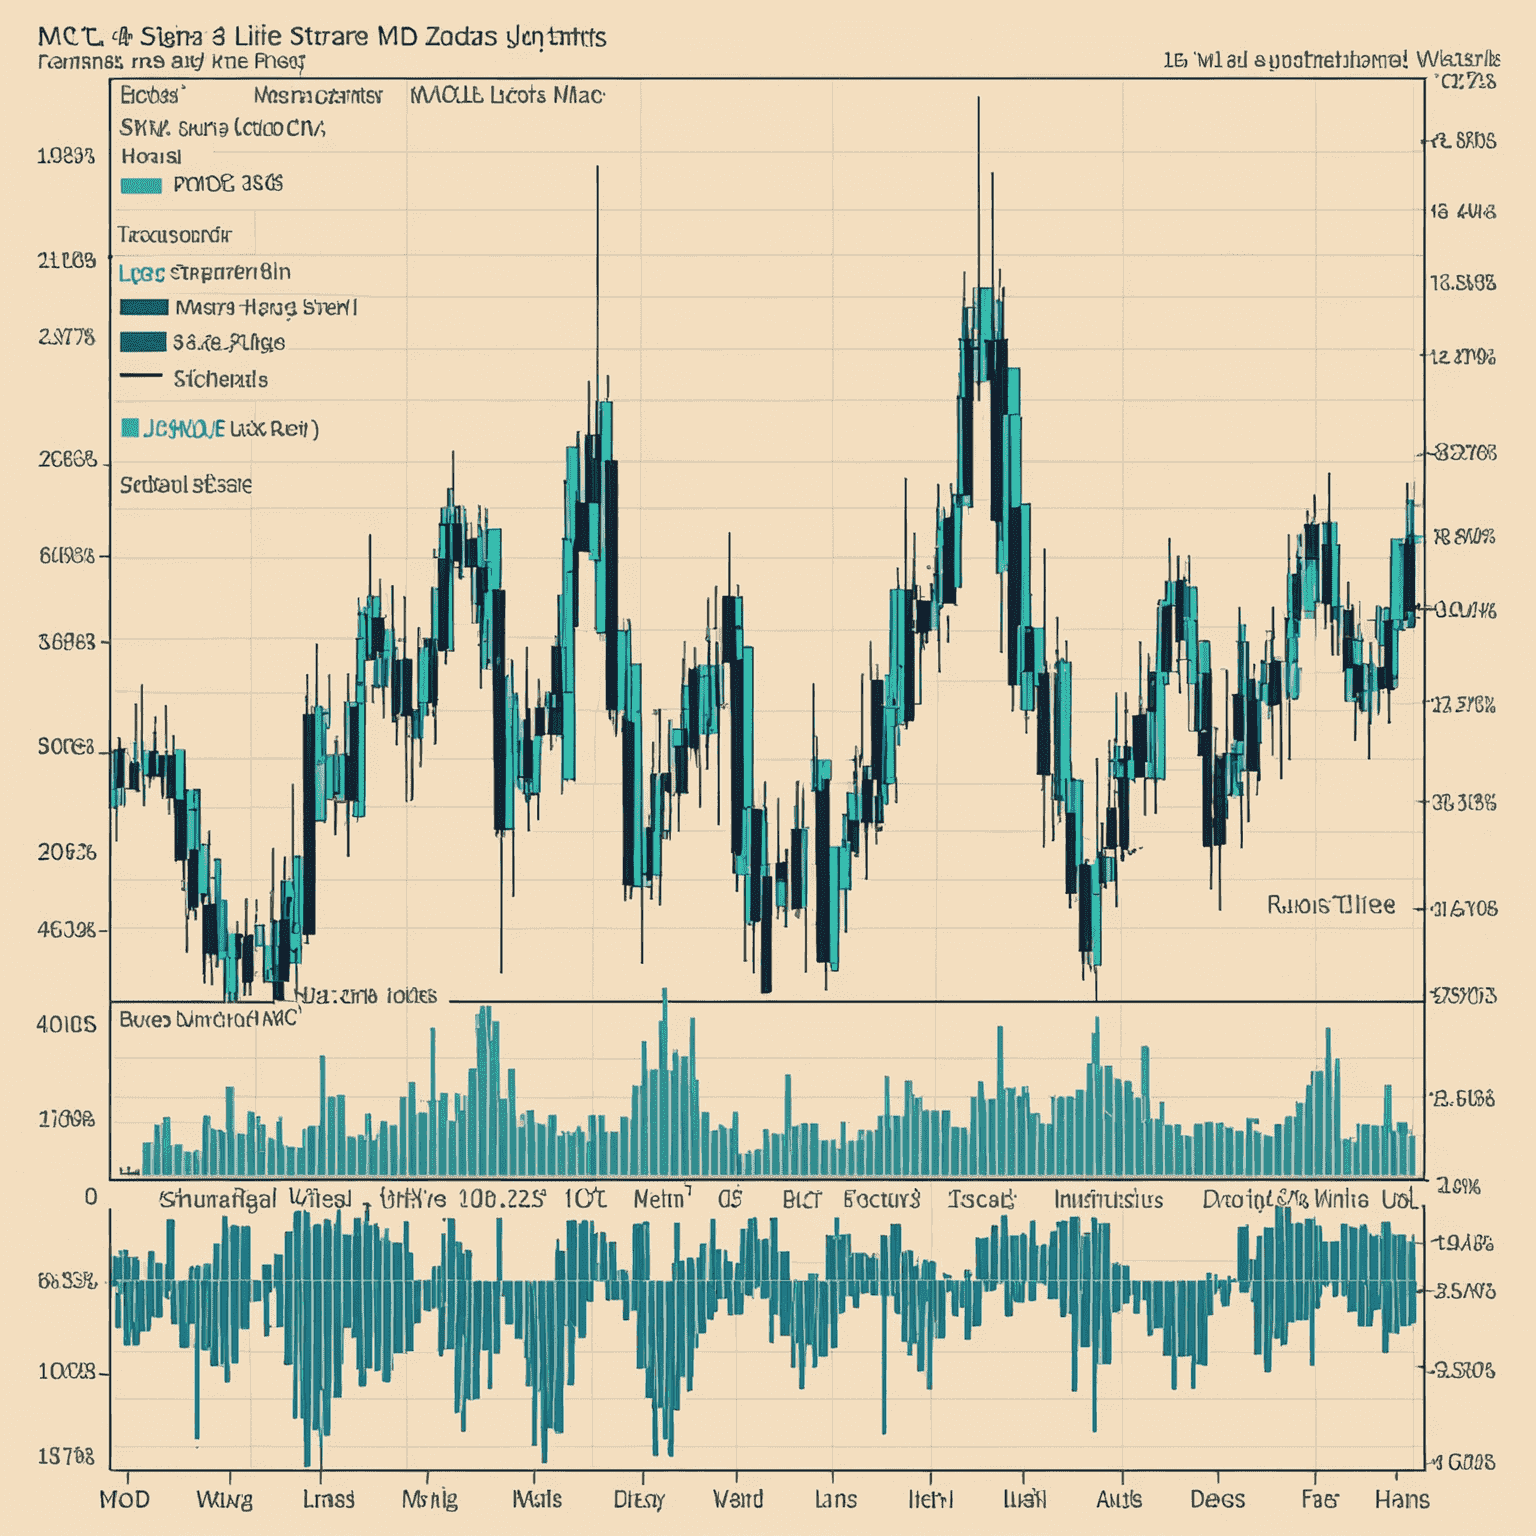
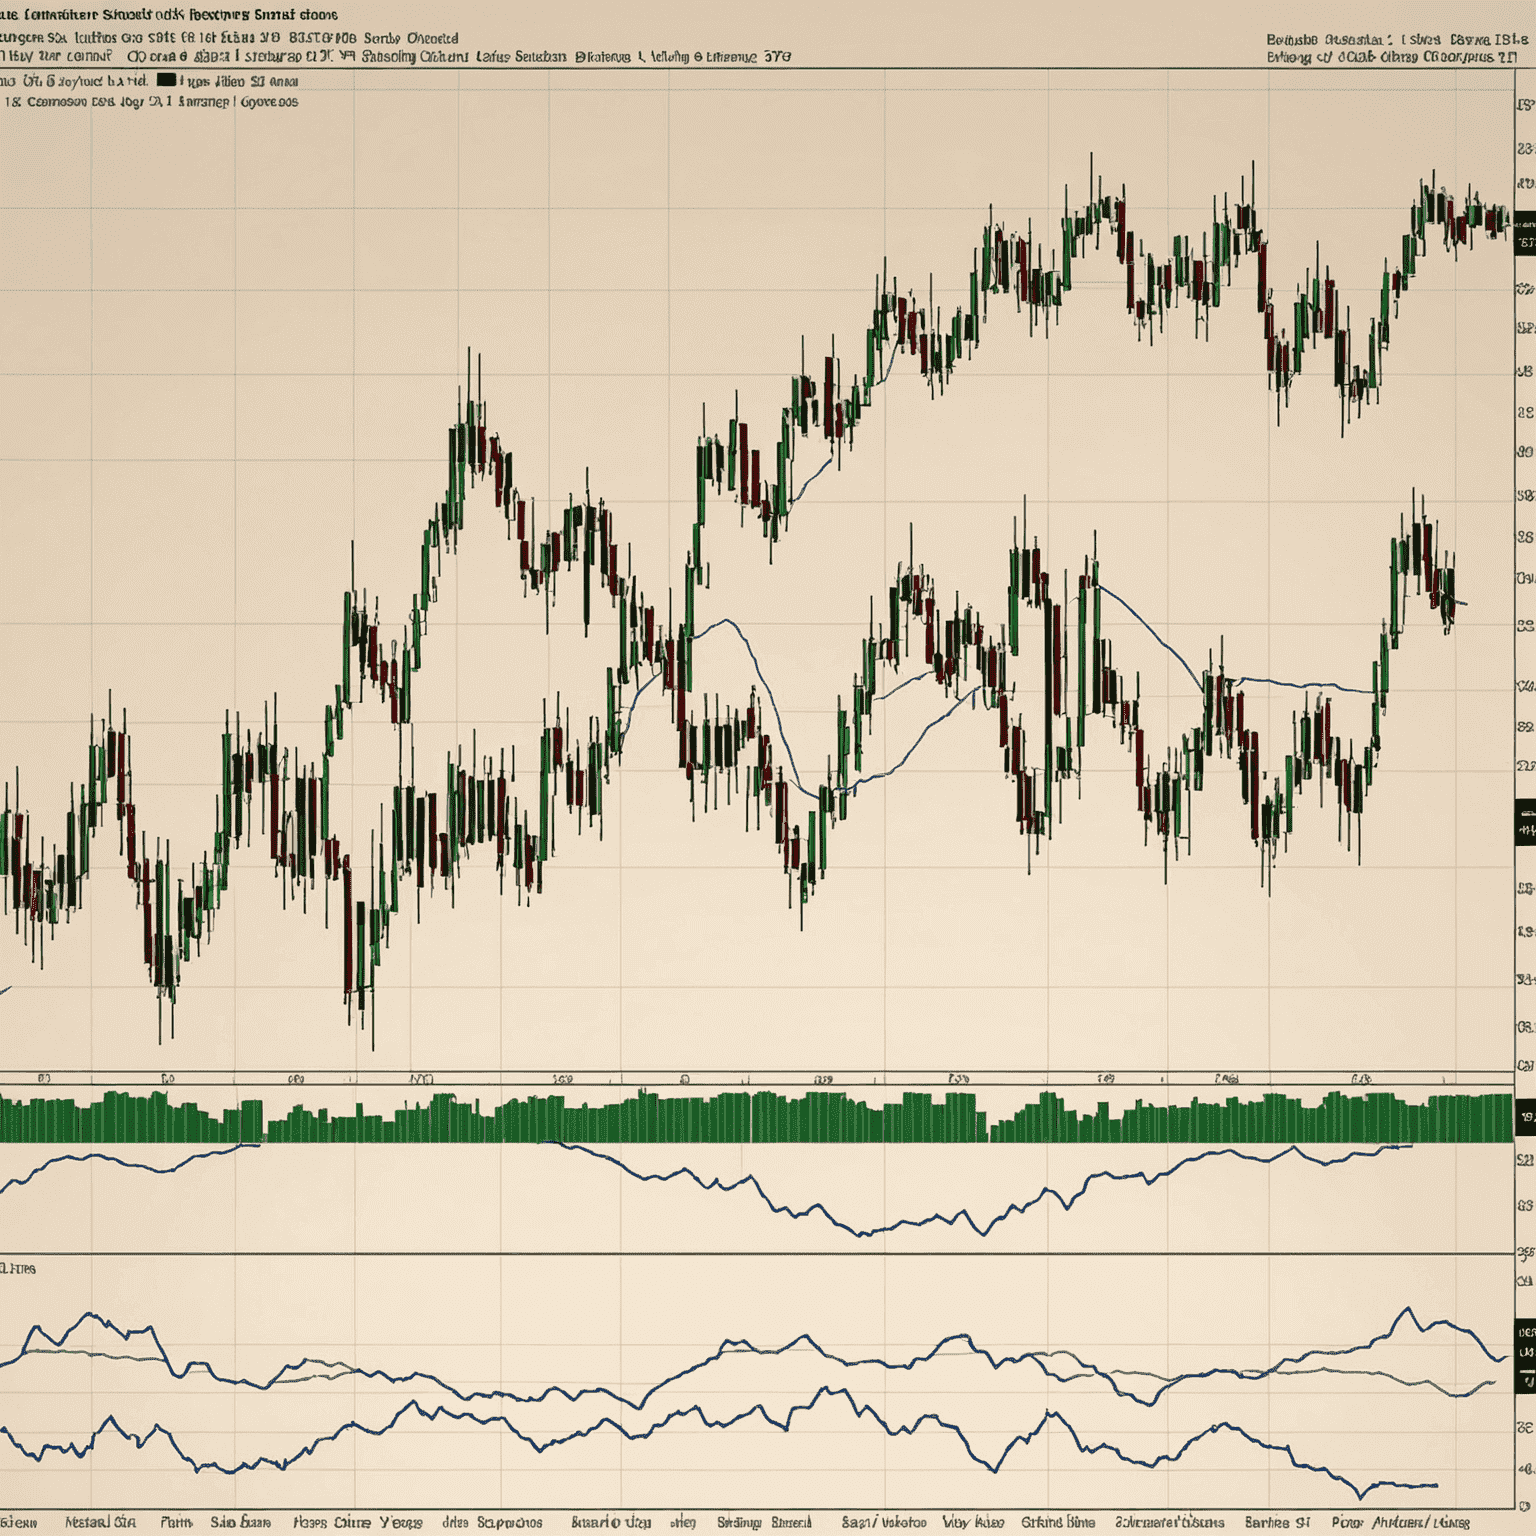
1. Moving Average (MA)
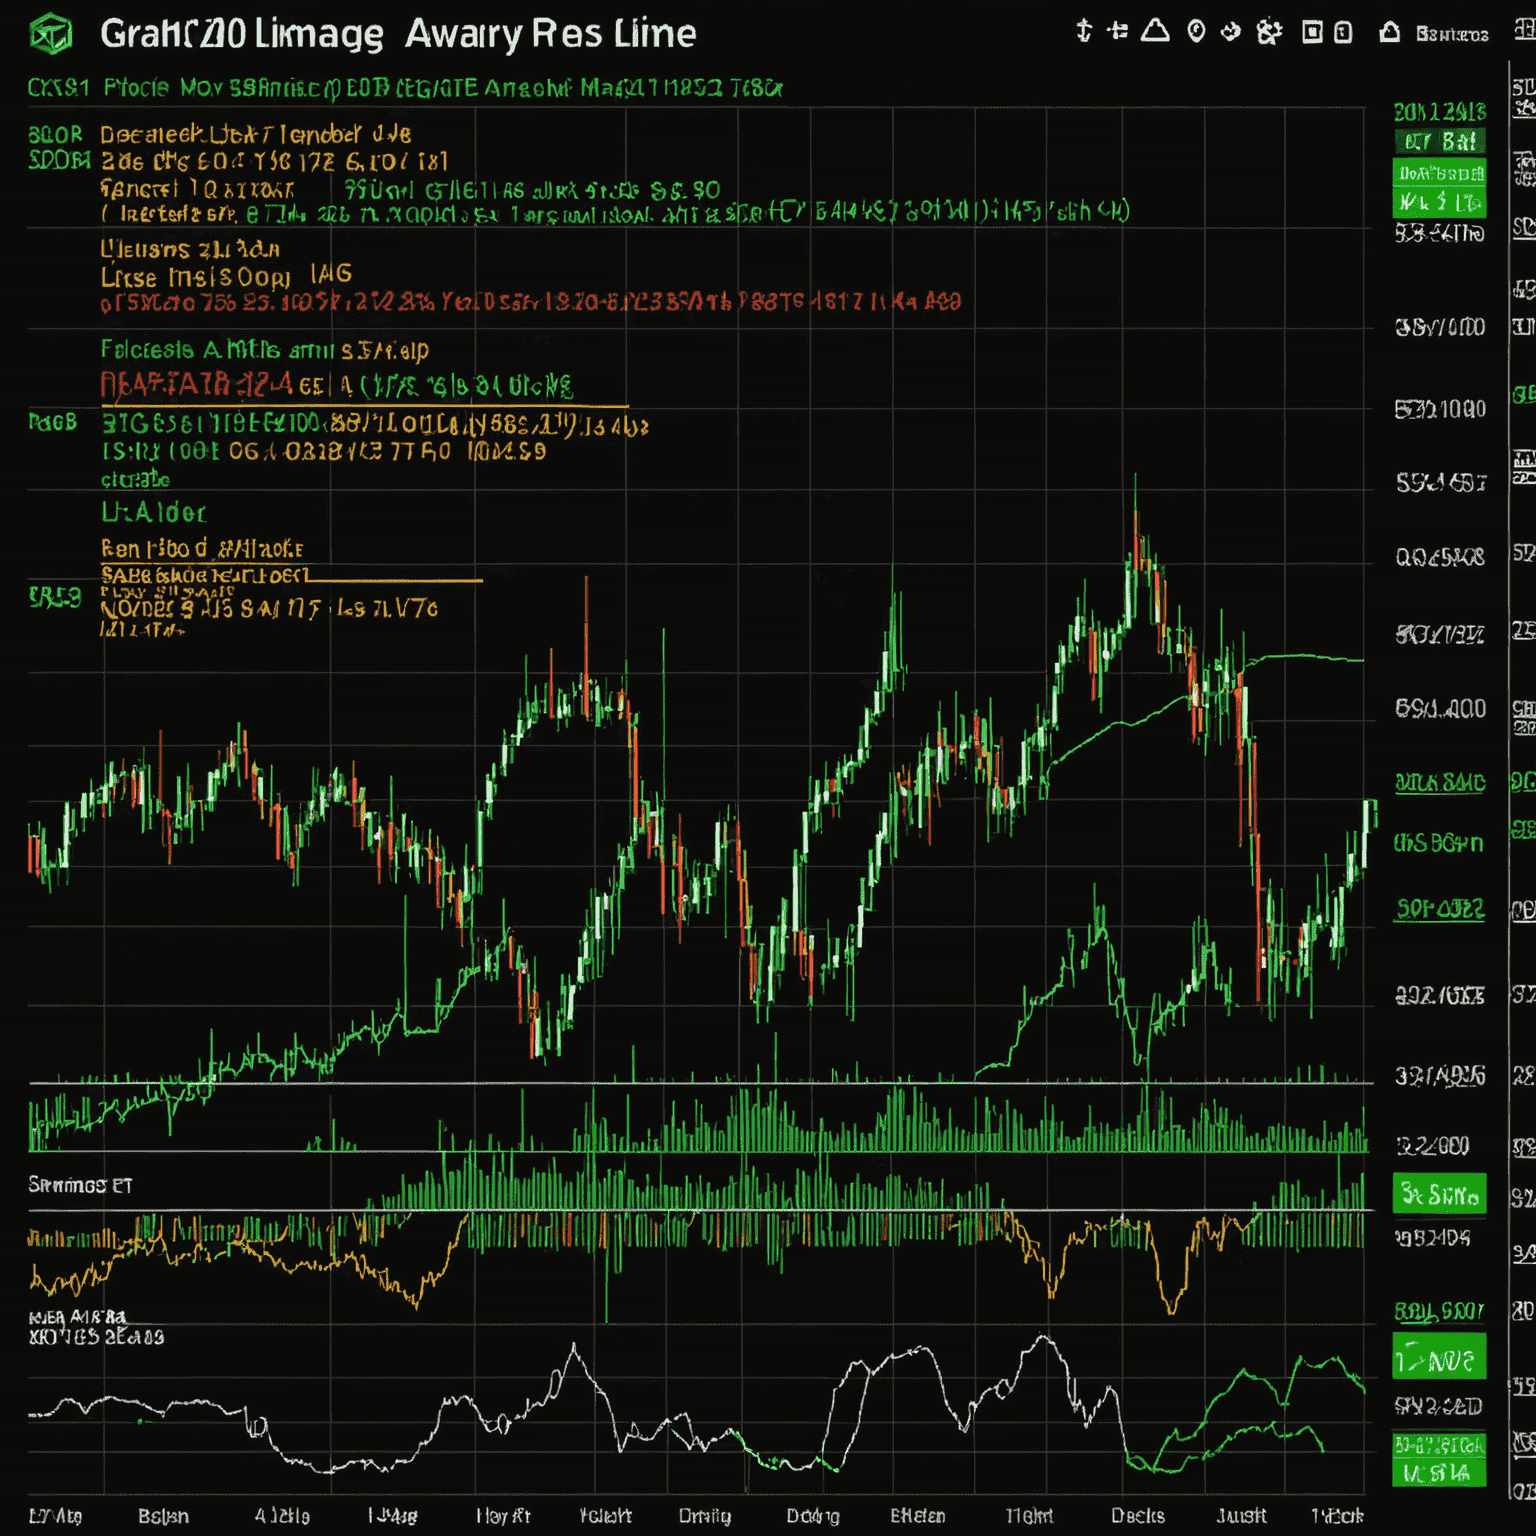
The Moving Average is one of the most widely used indicators in technical analysis. It smooths out price data over a specified period, helping traders identify trends and potential support and resistance levels. There are two main types: Simple Moving Average (SMA) and Exponential Moving Average (EMA).
2. Relative Strength Index (RSI)
The RSI is a momentum oscillator that measures the speed and change of price movements. It oscillates between 0 and 100 and is typically used to identify overbought or oversold conditions in a traded security. An RSI reading above 70 is considered overbought, while a reading below 30 is considered oversold.
3. Moving Average Convergence Divergence (MACD)
The MACD is a trend-following momentum indicator that shows the relationship between two moving averages of a security's price. It consists of the MACD line, signal line, and histogram. Traders use MACD to identify new trends, their direction, and their strength.
4. Bollinger Bands
Bollinger Bands consist of a middle band (usually a simple moving average) and an upper and lower band. These bands expand and contract based on the volatility of the price. Traders use Bollinger Bands to identify potential overbought and oversold conditions, as well as to gauge volatility.
5. Stochastic Oscillator
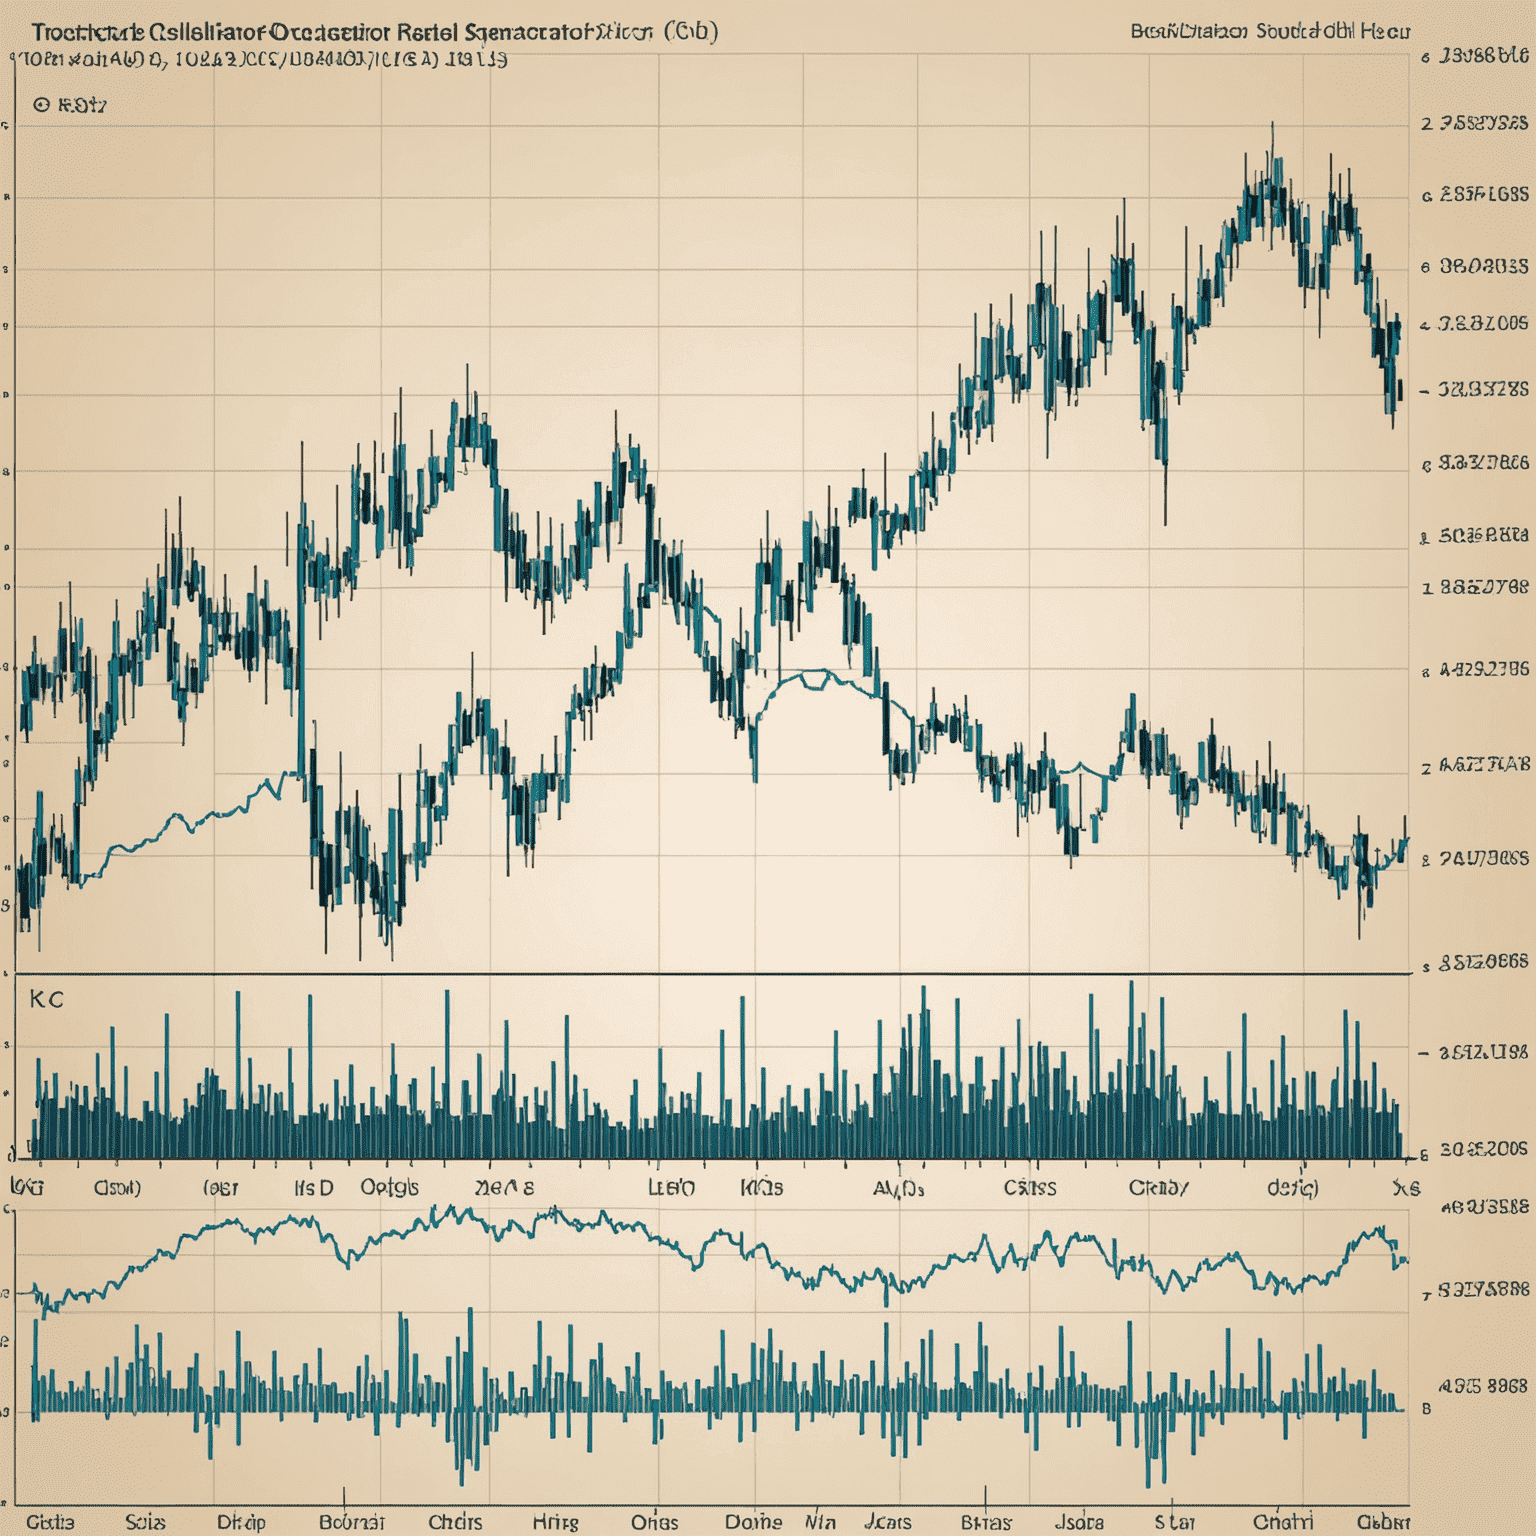
The Stochastic Oscillator is a momentum indicator that compares a particular closing price of a security to its price range over a certain period of time. It consists of two lines: %K and %D. This indicator is useful for identifying potential reversal points in the market.
Conclusion
These five technical indicators offervide a solid foundation for beginners to start analyzing market trends. Remember, while these tools are powerful, they should be used in conjunction with other forms of analysis and risk management strategies. As you gain experience, you'll learn how to combine these indicators effectively to make more informed trading decisions.
Keep practicing with these indicators on TradingView's platform to enhance your skills and develop your own trading strategy. With time and experience, you'll be able to harness the power of these technical tools to gain valuable market insights.